Food Research & Action Center
This may not sound like your usual trend search, but if you can bear it, hit #FoodStamps for a minute. I want you to notice a few things. Yes, first you’ll have to scroll past some relentless self-promotion from Atlanta hip-hop artist Supa Ju (not to be confused with Houston rapper Supa Ju), who has apparently just dropped a track of the same name. But after that you’re going to see some pretty fervent responses to United States Department of Agriculture (USDA) data released Friday on SNAP (Supplemental Nutrition Assistance Program, formerly known as “food stamps”) participation.
We’re going to need more than 140 characters for this part: The most recent numbers from May show a steady drop in participation from the first of the year—1,195,108 fewer participants since January of 2017, to be exact. And consistent decline has been the trend since participation peaked in October of 2013, when the program had 47,415,754 participants, versus the 41,496,255 documented in May.
Alt-right publication Breitbart saw the same data and reported the same numbers. It also used them as evidence that President Trump’s … what do we call them, policies? (that’s not quite accurate—rhetoric would be better) have been scaring immigrant users out of participation, convincing states to institute work-for-benefits laws (already in place and already quite stringent), and just generally, in the words of one Twitter user, “SAVING THE COUNTRY BILLIONS OF DOLLARS.”
I shall not belabor the Breitbart. If you’d like a steadier take on declining participation, Newsweek published an explainer last month that gets right to the point: The economy improved, states dropped recession waivers, and 500,000 to 1 million people lost their benefits. End.
But the problem with participation data is and has been that they don’t give us much insight about users beyond their race, what state they live in, whether they have children, whether they are children (age 18 or younger), and what their average benefit is. (In June, I reported on this very issue as it related to immigrant farmworkers).
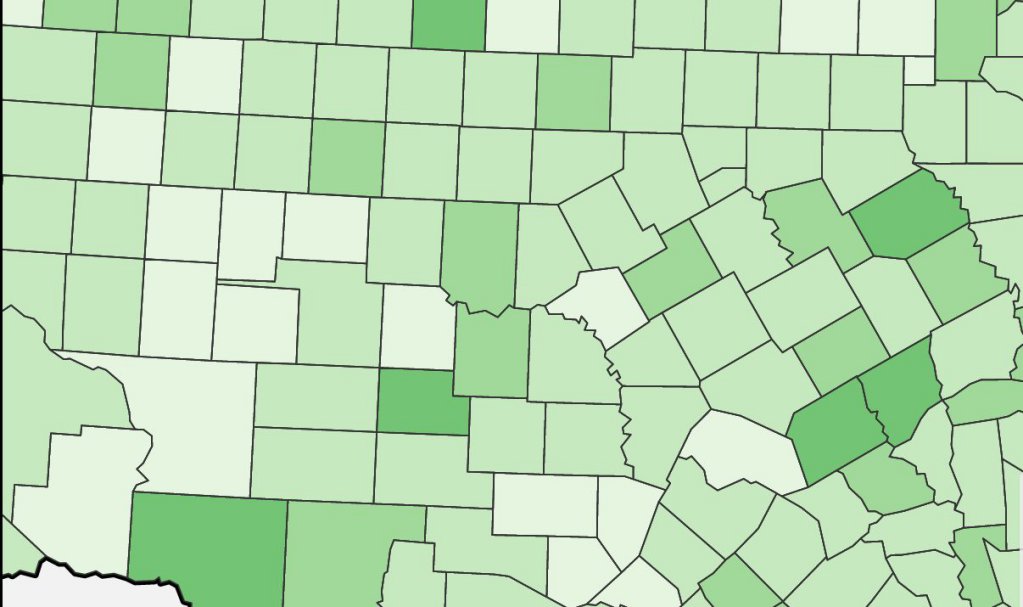
Those data are fine for headline fodder, but they make it hard to generalize—or disprove pernicious claims—about who’s most reliant on food stamps. Numbers that tell us something new about how regional economies are faring, for instance, can be pretty tough to pin down. That’s why we were particularly interested in a new data tool released last week from the Food Research & Action Center (or FRAC, regrettably) a nonprofit organization working to eradicate poverty-related hunger and undernutrition in the United States.
SNAP Maps is an interactive, searchable mapping tool that provides state-by-state household participation rates—by county. Based on American Community Survey (ACS) 5-Year data (2011-2015) and using Census Bureau criteria, each of the counties is divided into one of three categories: Metro (50,000 or more inhabitants), Small Town (10,000 or more inhabitants), and Rural (2,500 or more inhabitants). It’s those last two that show a surprising result: Their populations are especially hard hit by poverty and hunger. Fifteen percent of rural and small town households are food insecure, as compared to 12 percent of households in metro areas.
FRAC also released state-by-state factsheets using the ACS data that show statewide percentages of households on SNAP in the three categories—as well as each state’s share of SNAP households with children, families with working members, and those participating in the Temporary Assistance for Needy Families program.
Take this snapshot of West Virginia, for example, where Donald Trump soundly beat Hillary Clinton, 68.7 percent to her 26.5 in the 2016 election and where he remains deeply popular, especially in the rural counties that supported him: In all three categories, SNAP participation surpasses the national average. But in small towns it hovers around 17 percent and worse, in rural areas, at 19 percent.
It was also in July that the House Budget Committee approved a budget resolution that will require the House Agriculture Committee to identify $10 billion in cuts to nutrition and benefit programs over the next ten years. In addition, the plan proposes a $150 billion total cut to SNAP over the next decade.
“These proposed cuts would have devastating consequences for working families, children, seniors, people with disabilities, veterans, working families, and others in rural, small town, and metro communities,” said FRAC president Jim Weill in a statement on the data findings. “Without question, hunger and poverty in this country would become far worse.”
It was in West Virginia, don’t forget, that Governor Jim Justice announced in July he would be switching from the Democratic Party to the Republican Party. His defection may unnerve SNAP participants slightly less than the president’s agenda would seem to: Justice defended proposed cuts to Medicare, another program that benefits the state’s rural poor.
And it’s at the state level that the FRAC tool may prove most useful. The organization said it hopes it will “allow local, state, and national policymakers and program administrators, as well as advocates, media, and others, to understand how substantial numbers of struggling families in every county across the country need help from SNAP. It will also serve to dispel too-frequently repeated myths and stereotypes.”
Well, it’s a start.