Matt Kelly
Drought. The word brings a common image to mind: dry, cracked earth and hot, cloudless skies. But that’s not the only way drought presents itself. Much of the time, its presence is more or less invisible to the casual observer.
Which means you might never know that New York State is suffering through a severe drought this year, one of the worst in its history. That’s because the impact here looks nothing like conditions in California, the state we most immediately associate with drought. The hills aren’t bursting into flames, farmers aren’t fighting over the federal canal system, and Gov. Andrew Cuomo isn’t issuing executive orders that liken water conservation to a new “way of life.”
The National Oceanic and Atmospheric Administration (NOAA) calls drought the “creeping phenomenon” because of the way it sneaks up on us. Drought is a disaster of absence, uniquely challenging to monitor because it involves a lack of water rather than a measurable abundance of it. And since drought doesn’t blow in like a hurricane, or float cars like a flood, you need an equally unique and nuanced tool—a network of scientists with sophisticated equipment and decades-old eyewitness testimony at their disposal—to really “see” it in the first place.
 Matt Kelly
 Parched cornfields in New York
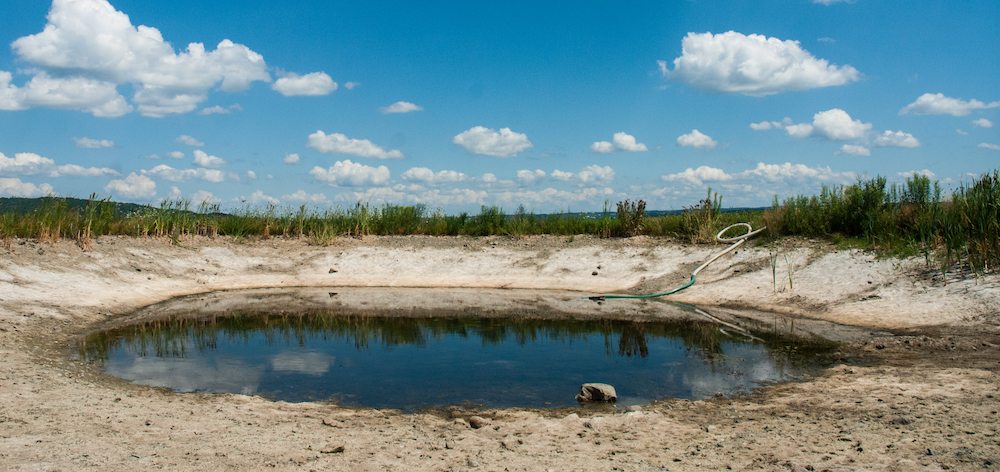
Drive along the rural roads in the western part of the state—where conditions are at their worst and you’ll see stunted, spiky corn. Grape, vegetable and grain production are all threatened. Livestock farmers have already begun feeding their animals hay because there has been no real pasture this year; at the same time, there is little hay stored away for the winter because there have been no second cuttings from the hayfields. Ponds and streams are running dry, and rainfall is down more than 25% across much of the state. The resulting increases in economic costs (both in terms of labor and logistics) are mounting.
It hasn’t been this bad in New York in a long time: this past June was the driest in some parts of the state since 1973. And according to Mark Wysocki — the state climatologist for New York and a senior lecturer in meteorology at Cornell—the last really severe drought in New York State was in 1965. The worst by far, from late 1930 until early 1932, lasted sixteen months. “In fact,” says Wysocki, “we have been in a period where we have not had many droughts.”
Which is why this one is so bad: no one was prepared.
Take a look at the animation below and you’ll see how harsh drought conditions roamed all around the country over the past fifteen years but essentially stayed clear of New York, until 2016.

Can’t see the animation above? Try this link.
This year’s conditions in New York are a perfect example of why drought is the most insidious natural disaster we face.
More than ever before, the U.S. is now suffering from billion-dollar disasters: natural events that cause a billion or more dollars of economic damage and loss per year. But drought tops the list. Between 1980 and 2015, drought inflicted $218.4 billion in losses; the average cost per event was $9.5 billion. This is more damage than any other type of natural disaster—flooding, freezes, severe storms, winter storms, or wildfire—with the exception of tropical cyclones. A total of 23 billion-dollar droughts occurred in those three and a half decades. But here’s the thing: between 1981 and 1985, there was only a single billion-dollar drought. Between 2011 and 2015, there were five.
“The perception of drought isn’t as sexy as a tornado or an earthquake,” says Mark Svoboda, a climatologist and Monitoring Program Area Leader at the National Drought Mitigation Center (NDMC) in Lincoln, Nebraska. As a result, the nuances of drought are little understood by the general public.
In 1999, Svoboda helped co-create the U.S. Drought Monitor, a valuable tool that helps us see where drought is creeping in and taking hold. The USDM represents current conditions across the nation and in individual states through a series of weekly maps color-coded to signify five different degrees of severity:
 U.S. Drought Monitor
The USDM is not a declaration of drought; declarations are made by federal, state and local agencies – using the USDM. Nor is it a prediction of future conditions. “It’s a current snapshot,” says Svoboda.
The maps are created through the efforts of the NDMC, NOAA, and the U.S. Department of Agriculture, a collaboration that’s essential because monitoring and measuring drought means much more than quantifying the absence of water.

Reports are generated by twelve different authors, drawn from each of the collaborating agencies, who work in two-week shifts. Each author collects drought information from across the country, adjusting the lines on maps of the nation and all fifty states, getting feedback on the adjustments from various experts across the country, readjusting the lines as appropriate, and then posting the maps for the public by Thursday of the same week. To accomplish this, the authors rely on two main sources of information.
The first is the physical input, the hydrological data, the hard numbers: measurements like the Palmer Drought Severity Index; the Standardized Precipitation Index; the Keech-Byram Drought index for fire; satellite-based assessments of vegetative health; streamflow and reservoir levels; and soil moisture data from various models.
The second information source is plain old human observation: People all across the country provide data and descriptions of what they are seeing and experiencing. A majority of these individuals are experts in local weather service offices or at regional climate centers. But others are average citizen-observers. The USDM is increasingly using observational reports from CoCoRaHS: the Community Collaborative Rain, Hail and Snow Network, a non-profit, community-based organization of volunteers working together to measure and map precipitation in all fifty states.

The USDM relies on citizen-observers to gather information about precipitation across the country. Above, restricted water usage in California
Once each author has gathered information for a specific region—both hard data and eyewitness—it’s time to bump it up against historical information. Of course, satellite imagery and its related indices go back only a few decades, but records based on human reports can stretch back a century or more. Many are based on the work of cooperative extension observers, who were often rural folks—farmers—providing input about the weather trends they saw.
Today, unfortunately, this observational network isn’t as strong as it once was. As our population has shifted away from rural living, and as farmers become fewer in the field, we’re losing this on-the-ground reporting. Which is why networks like CoCoRaHS have become so important (and why they’re always looking for volunteers).
 U.S. Drought Monitor
 And yet this historical data is more important than ever for determining the magnitude of the current dry spell. When you look at the map of New York from the last week in August and see much of the western side covered by severe and extreme drought, that is not a simple comparison to last year or the last fifteen years. The author has categorized the conditions in western New York as “severe” and “extreme” by comparing them with information going back—when possible—to the 1800s.
Such comparisons have become so valuable that numerous government agencies rely on the Drought Monitor “snapshot” to make policy decisions. The USDA uses the USDM to declare disasters and implement low-interest loans. The IRS uses it for tax deferrals when livestock must be sold because of drought. State, local and tribal agencies use the USDM as the basis of declaring droughts in their communities and implementing water restrictions and other procedures.
Which was never the original intent for creating the USDM. “It was science before policy,” says Svoboda. And despite the demonstrated value this tool has for government, the media and the public, there is no line-item funding for the USDM. Svoboda says the collaborating agencies have to continually find a way to pay for it out of their own budgets.

Drought stunts crop growth. The corn pictured above was affected by a dry season in Missouri Valley, Iowa
Here in New York, with some of the toughest drought conditions in decades, it’s easy to curse the looming specter of climate change. But is global warming really to blame this time?
“Before we can say anything about this current drought period and climate change, a lot of statistical and numerical studies will have to be done,” says Wysocki. Given the fact that the Northeast has not seen any increase in drought events despite the rise in global temperatures, he says the answer – for now – is “no”.
Svoboda holds a similar view: “Anthropogenic influences play a role of course, but it is hard to say exactly how much of a role.” He also says Richard Seager of the Lamont-Doherty Earth Observatory at Columbia University might be the best person to answer the question.
Seager is a climate scientist who uses observations and climate models to understand the causes of past and present droughts and floods, and the ways in which hydroclimate will change in the future due to human-induced climate change. He says climate change models project that the Northeast should experience more precipitation, but that the increase should be very small to date. At the same time, continually warmer temperatures can cause soil to become drier, requiring greater amounts of water for agricultural purposes. And while conditions are currently becoming drier and drier in the Northeast in recent years, the region is also coming out of several decades of particularly wet weather.
“The decades from the 1970s to the first decade of the 21st century were much wetter than the early and mid 20th century. So current precipitation conditions look a bit like a return to more normal,” says Seager. “However, the Northeast has also steadily warmed, almost certainly due to global warming, and that will be exacerbating the dry conditions.”
His layered answer is one more indication of the complexity of drought itself.
Last year the American Meteorological Society (AMS) released a report looking at the possible influence of human-made climate change on individual extreme-weather events for 2014. Of the 32 events that they examined across all seven continents, the AMS found evidence that human activities influenced the occurrence of seventeen of those events. This was overwhelmingly true for extreme heat events, but not for drought. Which is not to say that human activities played no role; it’s just that, even for this group of scientists, assessing the cause of drought remains stubbornly difficult. As stated in the report:
Drought continues to be an event type where the results require significant context, and easy answers often remain elusive because of the many meteorological, hydrological, and societal drivers that combine to cause drought.
While it is unclear—even unlikely—that the 2016 drought in New York is the result of a changing climate, it alerts us to the weather extremes predicted to occur with increasing global temperatures: floods one year and drought the next. We could very well see the colors on the USDM map of New York swinging between white and red with greater frequency—and less predictability—than ever before.
Hurricanes and forest fires might make better TV. But the more we can do to make visible drought’s dramatic, if subtle, impact, the better prepared we’ll be to mitigate that impact and adapt to the volatility of a warming planet.